1 显示效果
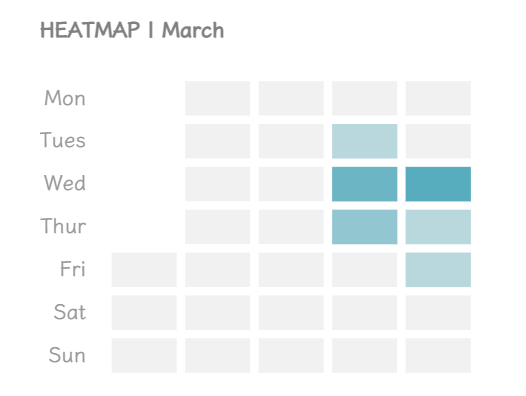
鼠标未移动到上面的时候,根据发表文章的数量显示热力图:
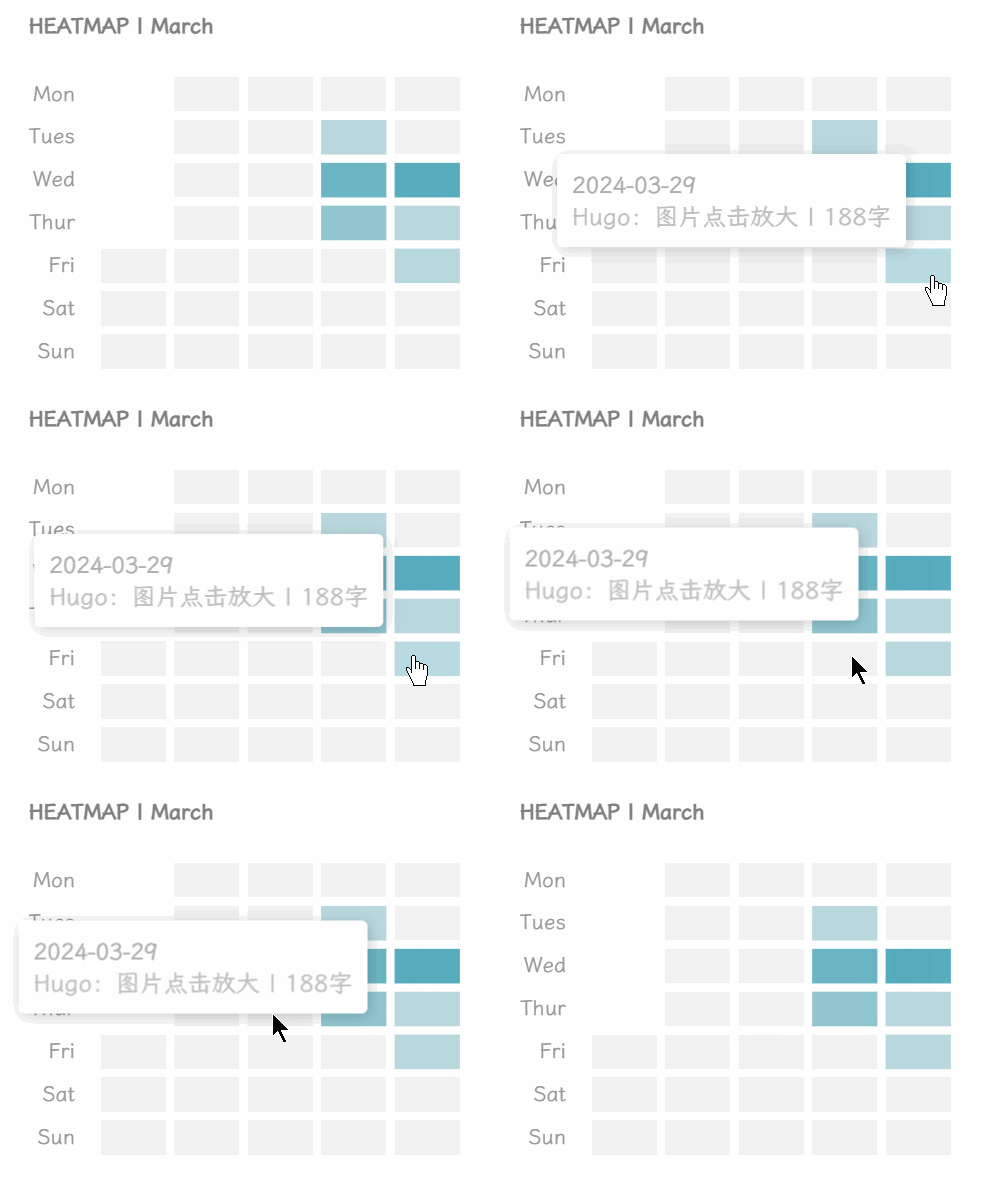
如果鼠标移动到上面,会显示当天发表的文章详情,并且可以点击进行跳转:
2 解决方案
本文解决方案参考 HUGO 折腾随记之热力图 / 段落导航 、如何给 Hugo 博客添加热力图 两位大佬的文章,并进行了改造。
改造点主要包括:
- 适应性改为侧边栏热力图
- 只显示一个月的文章发表记录,即一个月的热力图
添加文件: themes\hugo-theme-cleanwhite\layouts\partials\heatmap.html ,然后在 themes\hugo-theme-cleanwhite\layouts\partials\sidebar.html 中添加:
1<!-- heatmap -->
2<section>
3    <hr>
4    <h5>HEATMAP | {{ .Date.Format "January" }}</h5>
5	{{ partial "heatmap" . }}
6</section>
heatmap.html 的完整代码贴在下面:
  1<div id="heatmap" style="max-width: 290px;height: 200px;margin-bottom: 6px;"></div>
  2<!-- <script src="https://img.koobai.com/echarts.min.js"></script> -->
  3<script src="/js/echarts.min.js"></script>
  4<script type="text/javascript">
  5  var chartDom = document.getElementById('heatmap');
  6  var myChart = echarts.init(chartDom);
  7  window.onresize = function() {
  8      myChart.resize();
  9  };
 10  var option;
 11  var dataMap = new Map();
 12  {{ range ((where .Site.RegularPages "Type" "post")) }}
 13    var key = {{ .Date.Format "2006-01-02" }};
 14    var value = dataMap.get(key);
 15    var wordCount = {{ div .WordCount 1 }};
 16    var link = {{ .RelPermalink}};
 17    var title = {{ .Title }};
 18
 19    // multiple posts in same day
 20    if (value == null) {
 21      dataMap.set(key, [{wordCount,link, title}]);
 22    } else {
 23      value.push({wordCount,link, title});
 24    }
 25  {{- end -}}
 26
 27  var data = [];
 28  for (const [key, value] of dataMap.entries()) {
 29    data.push([key, value.length]);
 30  }
 31
 32  var currentDate = new Date();
 33  var currentYear = currentDate.getFullYear();
 34  var currentMonth = currentDate.getMonth();
 35  var firstDayCurrentMonth = new Date(currentYear, currentMonth, 1);
 36  var lastDayCurrentMonth = new Date(currentYear, currentMonth + 1, 0);
 37
 38  var startDate = echarts.format.formatTime('yyyy-MM-dd', firstDayCurrentMonth);
 39  var endDate = echarts.format.formatTime('yyyy-MM-dd', lastDayCurrentMonth);
 40
 41  // 检测浏览器主题模式并选择颜色方案
 42  var prefersDarkMode = window.matchMedia && window.matchMedia('(prefers-color-scheme: dark)').matches;
 43
 44  // 定义明亮模式下的颜色方案
 45  var lightTheme = {
 46      backgroundColor: '#FFFFFF',
 47      fangkuaicolor:'#F1F1F1',
 48      gaoliangcolor: ['#0085A121','#0085A1B8'],
 49      // gaoliangcolor: '#0085A1B8',
 50      riqiColor: '#999',
 51      textbrcolor: '#FFF',
 52      xiankuangcolor:'rgba(0, 0, 0, 0.0)',
 53  };
 54
 55  // 定义暗黑模式下的颜色方案
 56  var darkTheme = {
 57      backgroundColor: '#1A1718',
 58      fangkuaicolor:'#282325',
 59      gaoliangcolor: ['#b25f2f'],
 60      riqiColor: '#666',
 61      textbrcolor: '#332D2F',
 62      xiankuangcolor:'rgba(0, 0, 0, 0.0)',
 63  };
 64
 65  // 根据浏览器主题模式选择当前主题
 66  var currentTheme = prefersDarkMode ? darkTheme : lightTheme;
 67
 68  option = {
 69    tooltip: {
 70    hideDelay: 1000,
 71    enterable: true,
 72    backgroundColor: currentTheme.textbrcolor,
 73    borderWidth: 0, // 边框宽度为0
 74    formatter: function (p) {
 75        const date = p.data[0];
 76        const posts = dataMap.get(date);
 77        var content = `<span style="font-size: 1.5rem;font-family: LXGW WenKai Screen;color:#ABABAB">${date}</span>`;
 78        for (const [i, post] of posts.entries()) {
 79            content += "<br>";
 80            var link = post.link;
 81            var title = post.title;
 82            var wordCount = post.wordCount;
 83            content += `<a href="${link}" target="_blank" style="font-size: 1.6rem;font-family: LXGW WenKai Screen;">${title} | ${wordCount}字`;
 84        }
 85        return content;
 86        }
 87    },
 88    visualMap: {
 89        min: 0,
 90        max: 10,
 91        type: 'piecewise',
 92        show: false,
 93        hoverLink:true,
 94        inRange: {
 95          color: currentTheme.gaoliangcolor
 96          // color: ['#7aa8744c' ]
 97        },
 98        // itemGap: 20,
 99        showLabel: false,
100        splitNumber: 4,
101
102    },
103    calendar: {
104        left: 45,
105        top:0,
106        bottom:0,
107        right: 0,
108        cellSize: ['auto', 13],
109        range: [startDate, endDate],
110        itemStyle: {
111            color: currentTheme.fangkuaicolor,
112            borderWidth: 5.5,
113            borderColor: currentTheme.backgroundColor,
114        },
115        yearLabel: { show: false },
116        monthLabel: {
117          show: false
118        // nameMap: ['January', 'February', 'March', 'April', 'May', 'June', 'July', 'August', 'September', 'October', 'November', 'December'],
119        // textStyle: {
120        //     color: currentTheme.riqiColor,
121        // }
122    },
123        dayLabel: {
124
125            firstDay: 1,
126            nameMap: ['Sun', 'Mon', 'Tues', 'Wed', 'Thur', 'Fri', 'Sat'],
127            textStyle: {
128                color: currentTheme.riqiColor,
129                fontFamily:'LXGW WenKai Screen',
130                fontSize:14
131            }
132        },
133        splitLine: {
134            lineStyle: {
135                color: currentTheme.xiankuangcolor,
136            }
137        }
138    },
139    series: {
140        type: 'heatmap',
141        coordinateSystem: 'calendar',
142        data: data,
143    }
144  };
145
146  myChart.setOption(option);
147  myChart.on('click', function(params) {
148    if (params.componentType === 'series') {
149      // open the first post on the day
150      const post = dataMap.get(params.data[0])[0];
151      const link = window.location.origin + post.link;
152      window.open(link, '_blank').focus();
153    }
154});
155</script>
.jpg)

